Project Summary
Space weather is a term used to describe changing environmental conditions in the solar system caused by eruptions on the Sun's surface such as solar flares. Understanding and forecasting of solar eruptions is critically important for national security and for the economy since they are known to have adverse effects on critical technology infrastructure such as satellite and power distribution networks. Solar eruptions are caused by complex dynamics of sunspots which are often called solar active regions. The goal of this research is to build data infrastructure to characterize the properties of solar active regions from 1970 to now using advanced data from ground-based observatories and satellite missions. The database and associated cyberinfrastructure, jointly to be developed by physicists and computer scientists, will utilize advanced artificial intelligence and machine learning. By using this advanced database, a better understanding of the solar active regions and how they trigger solar eruptions will be achieved.
The project will build advanced computer infrastructure to characterize solar active regions (ARs) and apply machine learning tools to predict two most significant forms of solar eruptions: the solar flares and coronal mass ejections (CMEs). The project will address two key science questions: (1) Which parameters and physical processes are most important for the onset of solar eruptions? (2) What is the accuracy of using these parameters to predict solar eruptions? The work will utilize and interface with the infrastructure developed under a previous EarthCube project. It will analyze digitized and digital high-resolution data from the Big Bear Solar Observatory (BBSO) from 1970 to now, current satellite mission data, as well as legacy data for a more comprehensive archive of flares and associated ARs. Dynamic non-potentiality properties of ARs will be derived using advanced imaging and machine learning tools. Deep learning techniques will be used to trace fibril/loop structures in the solar chromosphere and corona. Combining these with coronal field extrapolation will provide novel parameters to describe non-potentiality in ARs. Two new parameters will be derived that may be critically linked to flares and CMEs: flow motions and magnetic helicity injection in flare productive ARs. Based on flare/CME properties and important parameters derived from hosting ARs, deep learning techniques will be further adapted to predict the occurrence and energy range of flares and CMEs.
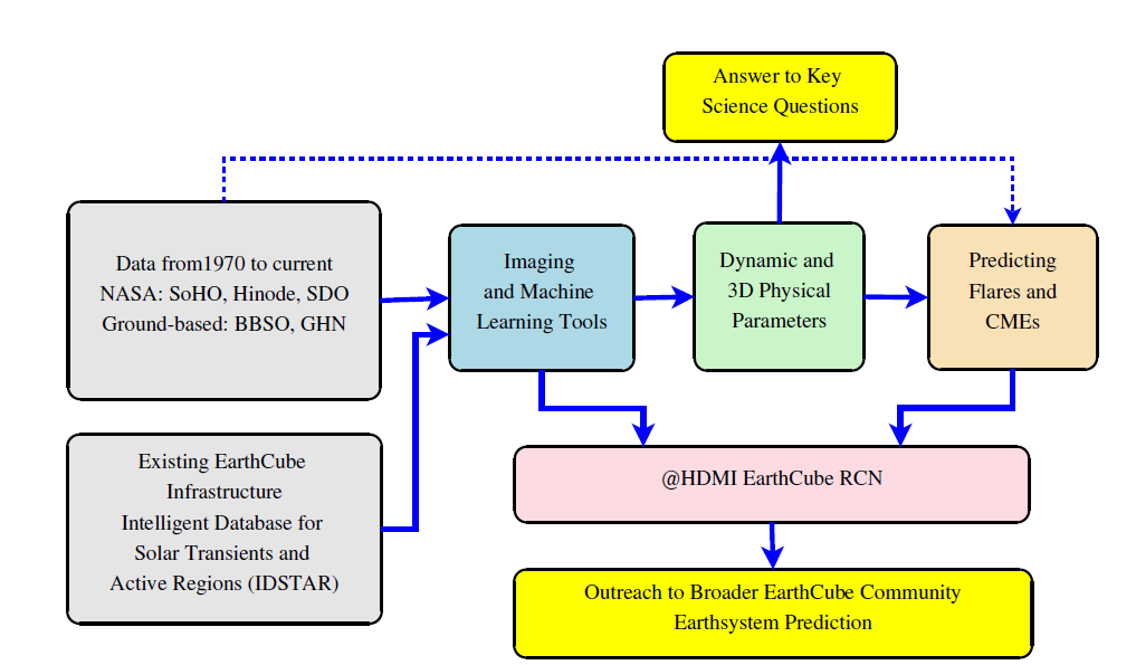
The flowchart below describes different project components, and the relationship between the project and the existing EarthCube infrastructure, EarthCube RCN and broader EarthCube community. The key inputs are unique data sources covering nearly 50 years of data in combination with the existing EarthCube infrastructure. Through innovative imaging and machine learning tools, dynamic physical parameters are derived to answer key scientific questions and provide prediction tools for solar eruptions. Both computational tools and prediction results are then linked to the broader EarthCube community for Earthsystem prediction.
Data Summary
The table below lists key active regions (ARs) with significant flare activities to be analyzed in the project.
| AR | Date | Source of Data | Flare Index |
|---|---|---|---|
| 0235 | August 1971 | BBSO Digitized | > 10 |
| 0331 | August 1972 | BBSO Digitized | > 10 |
| 1092 | April 1978 | BBSO Digitized | 12.6 |
| 1203 | July 1978 | BBSO Digitized | 29.9 |
| 2779 | November 1980 | BBSO Digitized | 29.0 |
| 3234 | July 1981 | BBSO Digitized | 13.3 |
| 3763 | Jun 1982 | BBSO Digitized | 45.2 |
| 3804 | July 1982 | BBSO Digitized | 40.5 |
| 4474 | April 1984 | BBSO Digitized | 23.1 |
| 5395 | March 1989 | BBSO Digitized | 55.6 |
| 5629 | August 1989 | BBSO Digitized | 34.1 |
| 6555 | March 1991 | BBSO Digitized | 32.6 |
| 6659 | June 1991 | BBSO Digitized | 77.6 |
| 10486 | October 2003 | BBSO, MDI | 77.6 |
| 10808 | September 2005 | BBSO, MDI | 46.9 |
| 10930 | December 2006 | BBSO, Hinode, MDI | 21.8 |
| 11158 | February 2011 | BBSO, HMI, Hinode | 4.04 |
| 11283 | September 2011 | BBSO, HMI, Hinode | 5.6 |
| 11429 | March 2012 | BBSO, HMI, Hinode | 12.0 |
| 11890 | November 2013 | BBSO, HMI, Hinode | 6.7 |
| 12192 | October 2014 | BBSO, HMI, Hinode | 19.7 |
| 12205 | November 2014 | BBSO, HMI, Hinode | 5.08 |
| 12371 | June 2015 | BBSO, HMI, Hinode | 2.3 |
| 12673 | September 2017 | BBSO, HMI, Hinode | 25.7 |
The table below lists key data products to be archived in our database. These images are processed, well aligned and labeled.
| Data Type | Source (cadence) | Related Products | Time Range |
|---|---|---|---|
| Hα | BBSO, GHN (1 min) | Flare Ribbons, Fibril Tracing | 1970 to now |
| Vector B Field | SDO/HMI (135 sec) | AR Parameters, Flows, NLFFF | 2010 to now |
| Vector B Field | Hinode (few hours) | AR Parameters, NLFFF | 2006 to now |
| LOS B Field | SOHO/MDI (96 min) | 3D Potential Field, AR Parameters | 1995-2010 |
| LOS B Field | NSO/KPVT (daily) | 3D Potential Field, AR Parameters | 1974-2003 |
| White Light | All above (various) | Photospheric Flows, Sunspot Structure | 1970 to now |
| Coronal Images | SDO/AIA (<1 min) | Coronal Structure | 2010 to now |
| X-ray Intensity | GOES (1 min) | Flare Magnitude | 1974 to now |
| CME Catalog | SOHO/LASCO | CME Speeds/Energy | 1995 to now |
| CME Catalog | SMM | CME Speeds/Energy | 1980 to 1989 |